Optimize your Warehouse Layout for BFCM - Part 2
 Fulfil
In this second part, we go through the last steps to optimize your warehouse layout for BFCM.

Introduction
If you haven’t already, make sure to check out Part 1 of this article for information on how to query and verify the data that you’ll be using for this analysis.
As a quick reminder, here are the steps that are taken during this optimization process:
- Query data
- Verify data relevancy
- Classify SKUs
- Analyze Shipment Data based on Classification
- Adjust on the fly
This article starts at Step 3 in the above list.
Step 3: Classify your SKUs (ABC)
Now that you have the raw customer shipment data, you can classify the SKUs into categories based on their contribution towards total quantity sold.
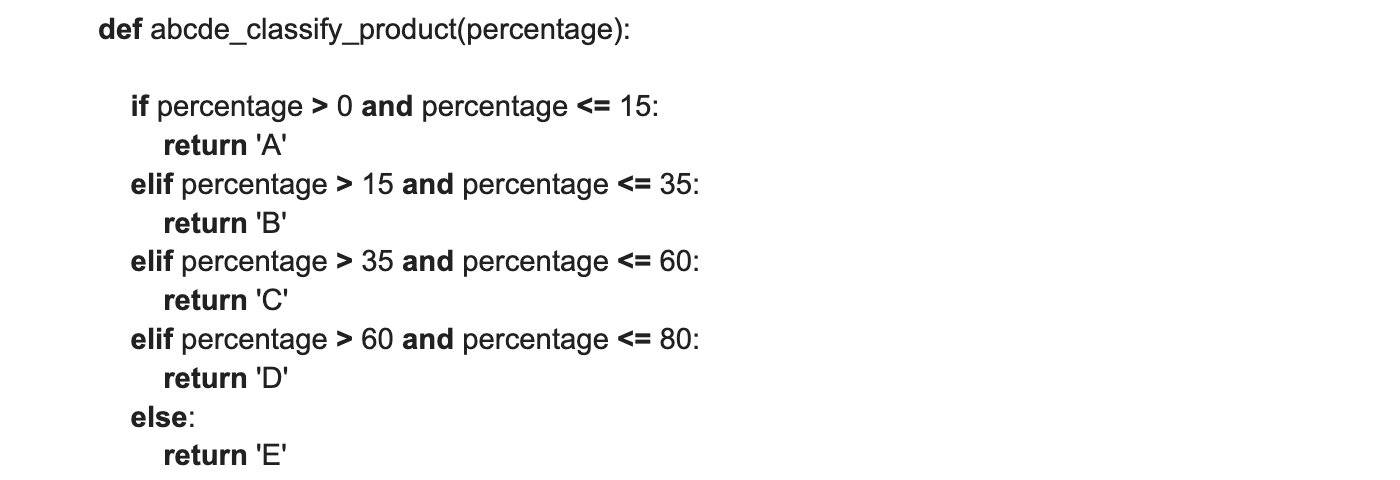
Specifically, a classification of A, B, C, D, or E is applied based on the ranked percentage of total quantity:
- A = 0 - 15
- B = 15 - 35
- C = 35 - 60
- D = 60 - 80
- E = 80 - 100
This can be done using a simple classification function as shown below:
Followed by the analysis itself on the given time frame:
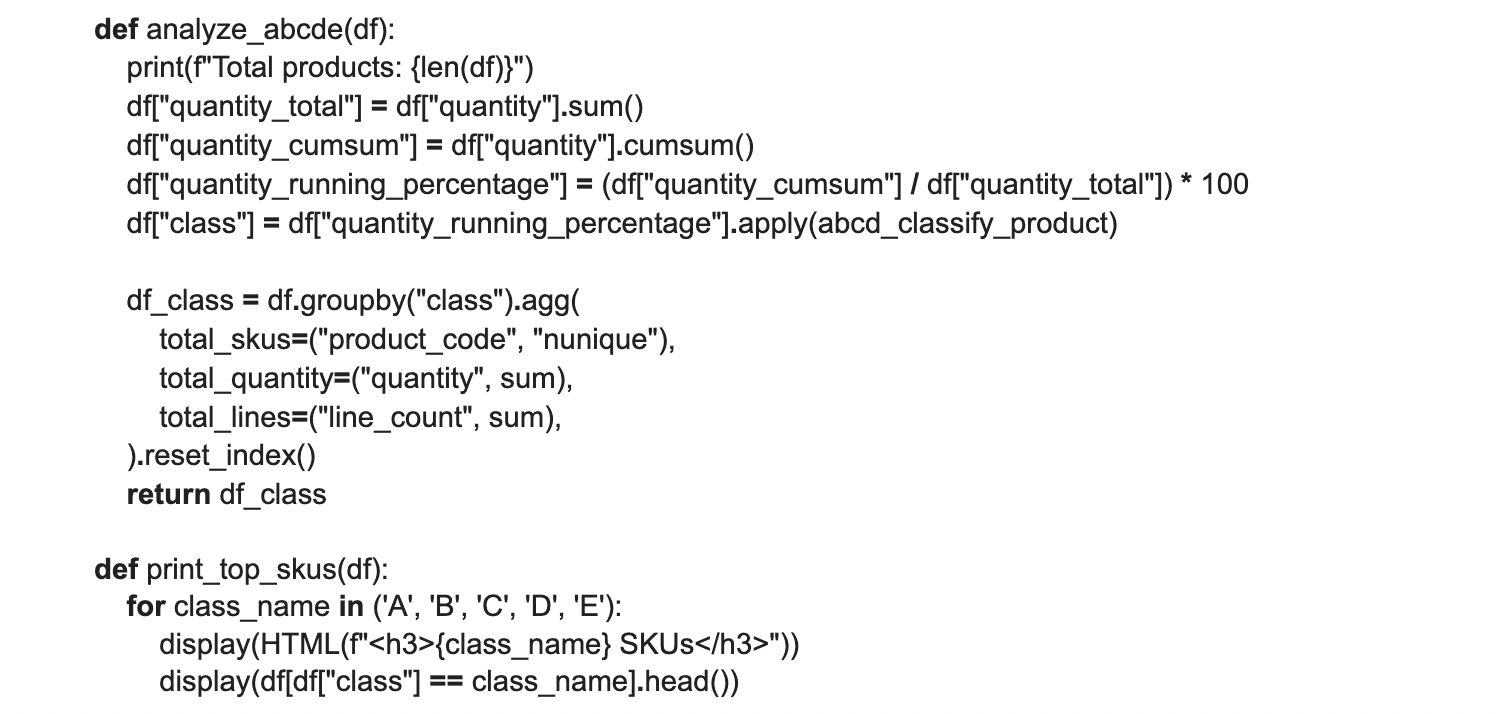
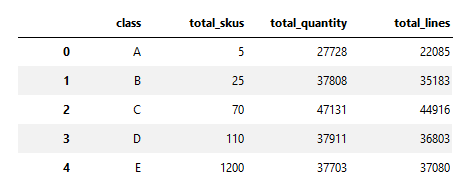
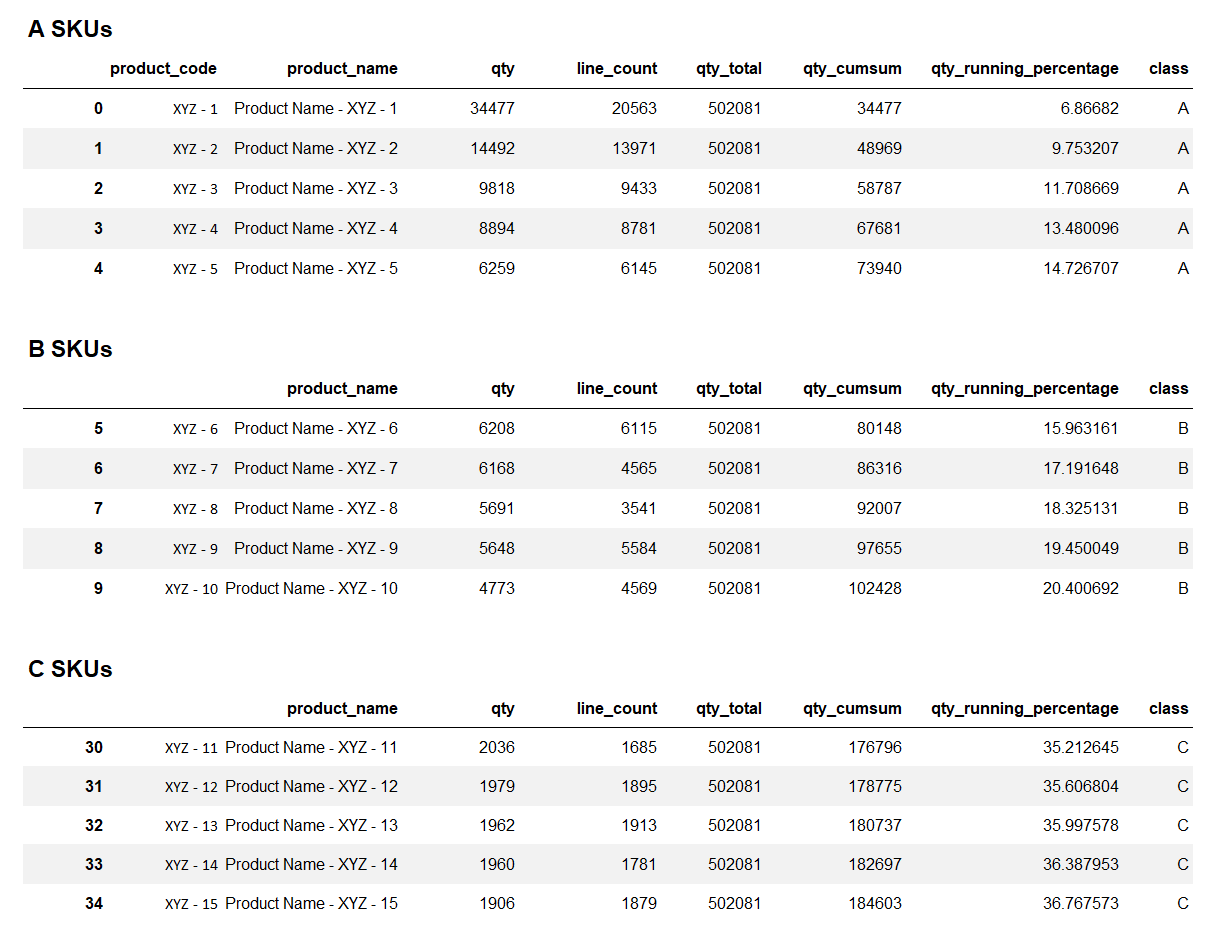
The output of this analysis should be twofold:
- A summary of number of SKUs per Classification
- Top 5 SKUs in each category
Classification Summary:
Top 5 SKUs per Category:
Step 4: Analyze Shipments based on Classification
Now that you have your SKUs classified, it’s important to perform a secondary analysis on the customer shipments. This will show the distribution of SKUs on a shipment level, and how often certain classes are grouped or bought together.
The following query can be used to generate this information:
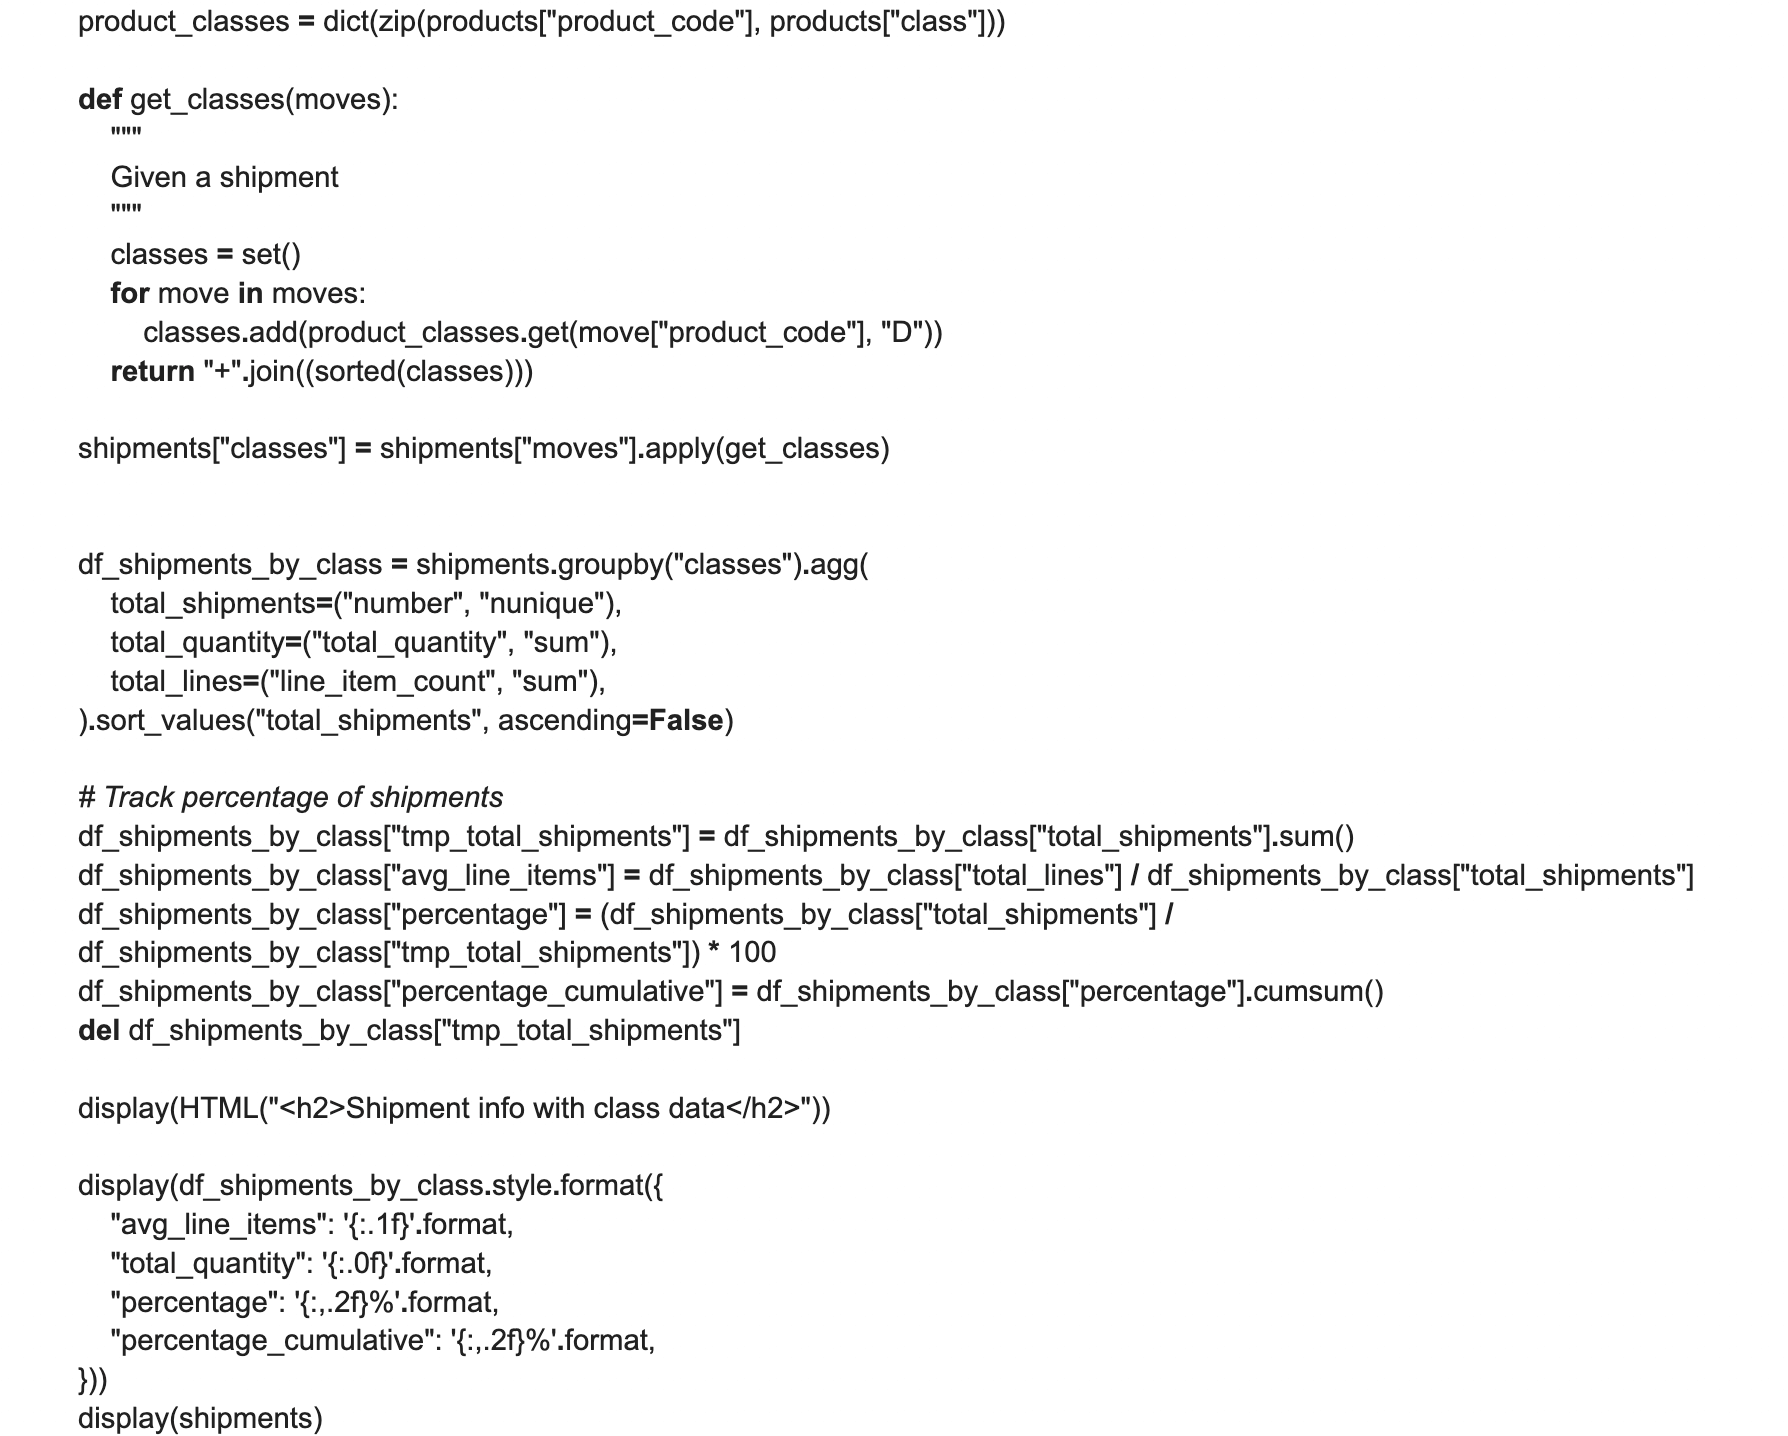
The output of which will be a table similar to the one below:
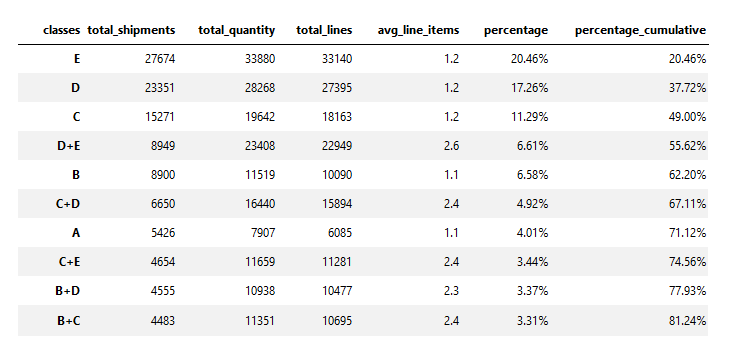
As you can see, ~60% of customer shipments only contain items from a single class.
Note that this table is abbreviated, as we recommend only optimizing for the top 80% of the cumulative percentage of shipments.
You should use the above table to inform the layout of your warehouse - the products that are the most commonly shipped should be stored in the closest pick-up locations to minimize traffic and picking distances. The number and size of bins dedicated to each SKU classification should be determined by the total quantity. To minimize the number of replenishments throughout the day, more picking space should be allocated as quantity increases.
Step 5: Adjust on the Fly
As a final step, this process should be repeated on a daily basis, using the previous day's data, to ensure the projected classifications match the actual. Variations from the projected classification can often be caused by factors such as sales, promotions, and upsells.
Moreover, bin replenishments from overstock to picking must be carefully monitored as well. If the inventory level of a particular bin falls below the minimum threshold, a transfer from overstock to replenish the bin is required. When these transfers are executed, they require additional resources, which can disrupt the warehouse team's flow. The target here is not to reach zero, which would likely require extremely oversized bin locations, but rather to target no more than 1-2 replenishments per day.
Finally, you should calculate how many times each bin is visited by a picker. In a small space such as a picking zone, congestion can cause bottlenecks, so it's important to identify which bins are most frequently visited. If you find a specific bin is being visited a disproportionate amount of times, consider adding additional bins for this product in a separate picking aisle to divide the traffic.
What’s Next?
While incredibly useful for BFCM, this exercise is a useful tool to be used throughout the rest of the year as well. The more volume of customer shipments that are leaving the warehouse, the more return on investment you will get from small improvements that can be achieved using analyses like this one.
If you’d like a copy of all of the queries used within this process, or if you’re interested in learning more about Fulfil’s Data Warehouse, reach out and book a demo with our team!
Tags:

Fulfil
Fulfil is the AI-native ERP built for modern Shopify and DTC brands. No consultants. No middleware. No surprises. Connect your sales channels, warehouses, accounting, and fulfillment in one system. Set up in weeks, not months.